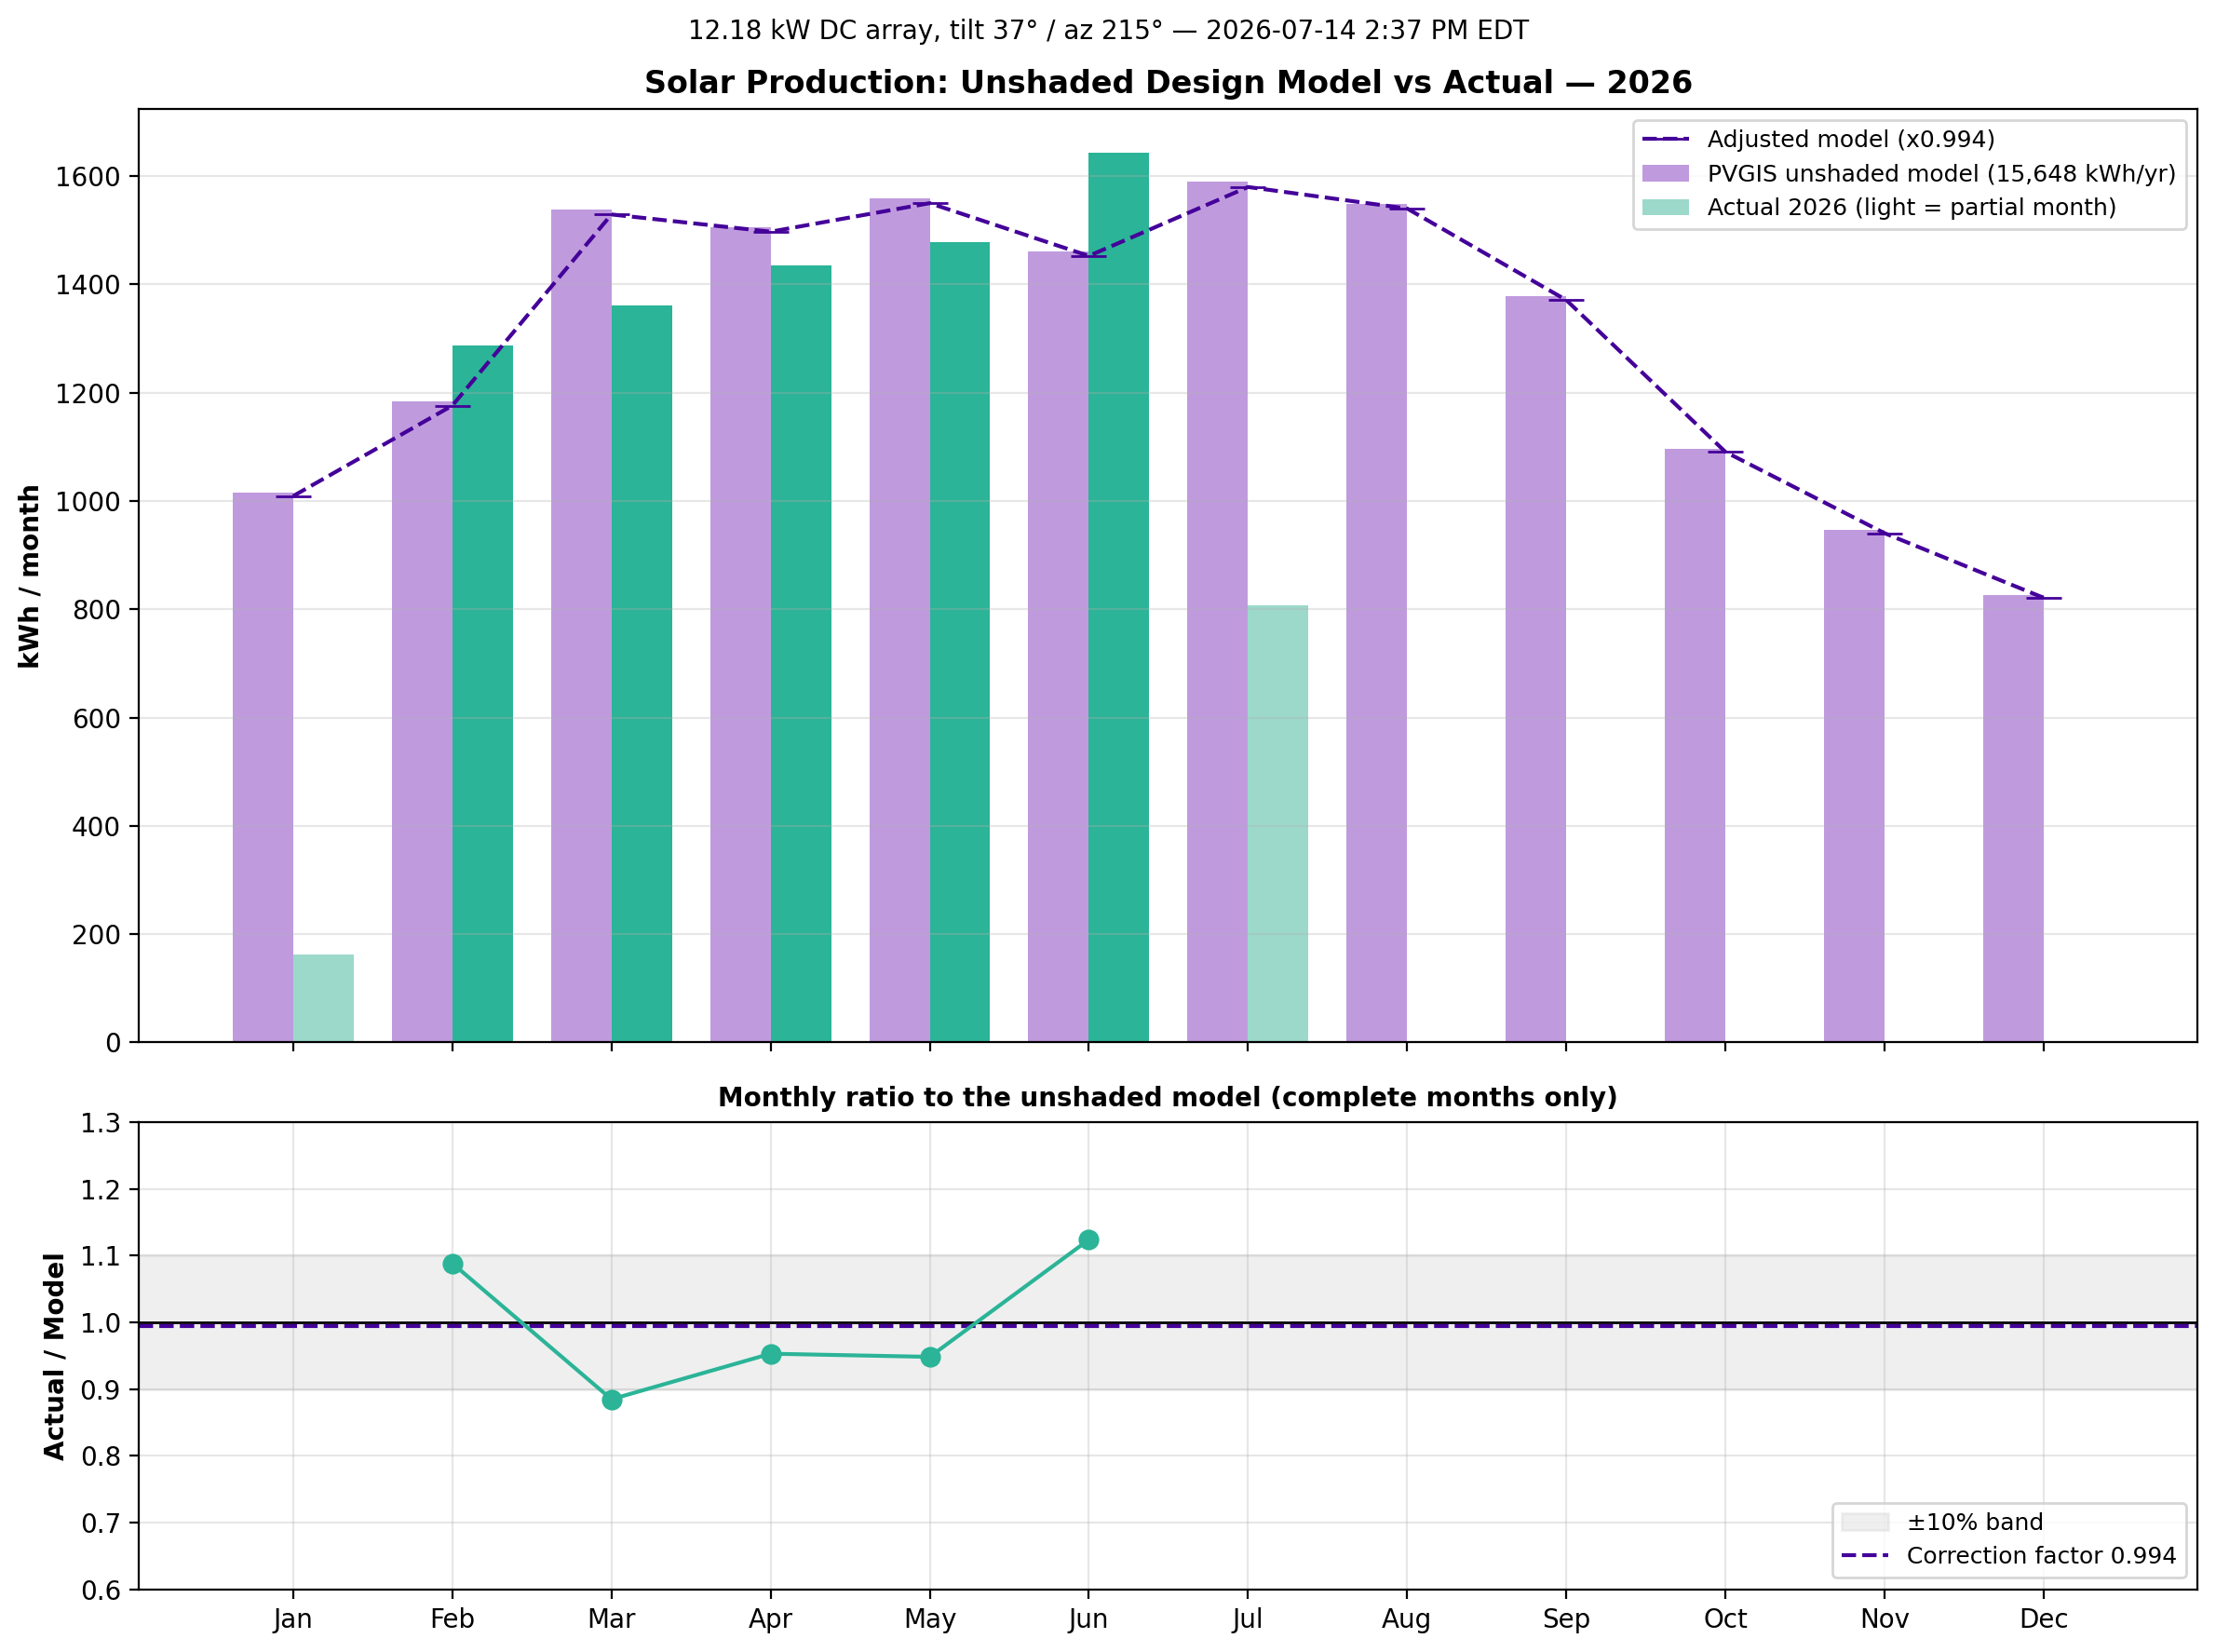
The array was commissioned January 28, 2026. This assessment uses 8 complete month(s) of revenue-grade SolarEdge production (2026-02, 2026-03, 2026-04, 2026-05, 2026-06, 2026-07, 2026-08, 2026-09) plus 2 partial month(s), measured against the unshaded PVGIS design model of 15,648 kWh/yr.
Measured performance is 99.4% of the unshaded model — the array is performing at the design ceiling. The feared tree-shade derate (the competing installer's estimate implied roughly 15% loss, and the planning band assumed 13,500–14,500 kWh/yr) is not materializing in the months observed so far.
Monthly scatter is real weather, not fault: the best month (2026-06) ran +12% against the model and the worst (2026-03) -12%. The production-weighted factor smooths this into one number.
Winter evidence so far comes from month(s) February, March; snow and low-sun shading are partially represented in the factor.
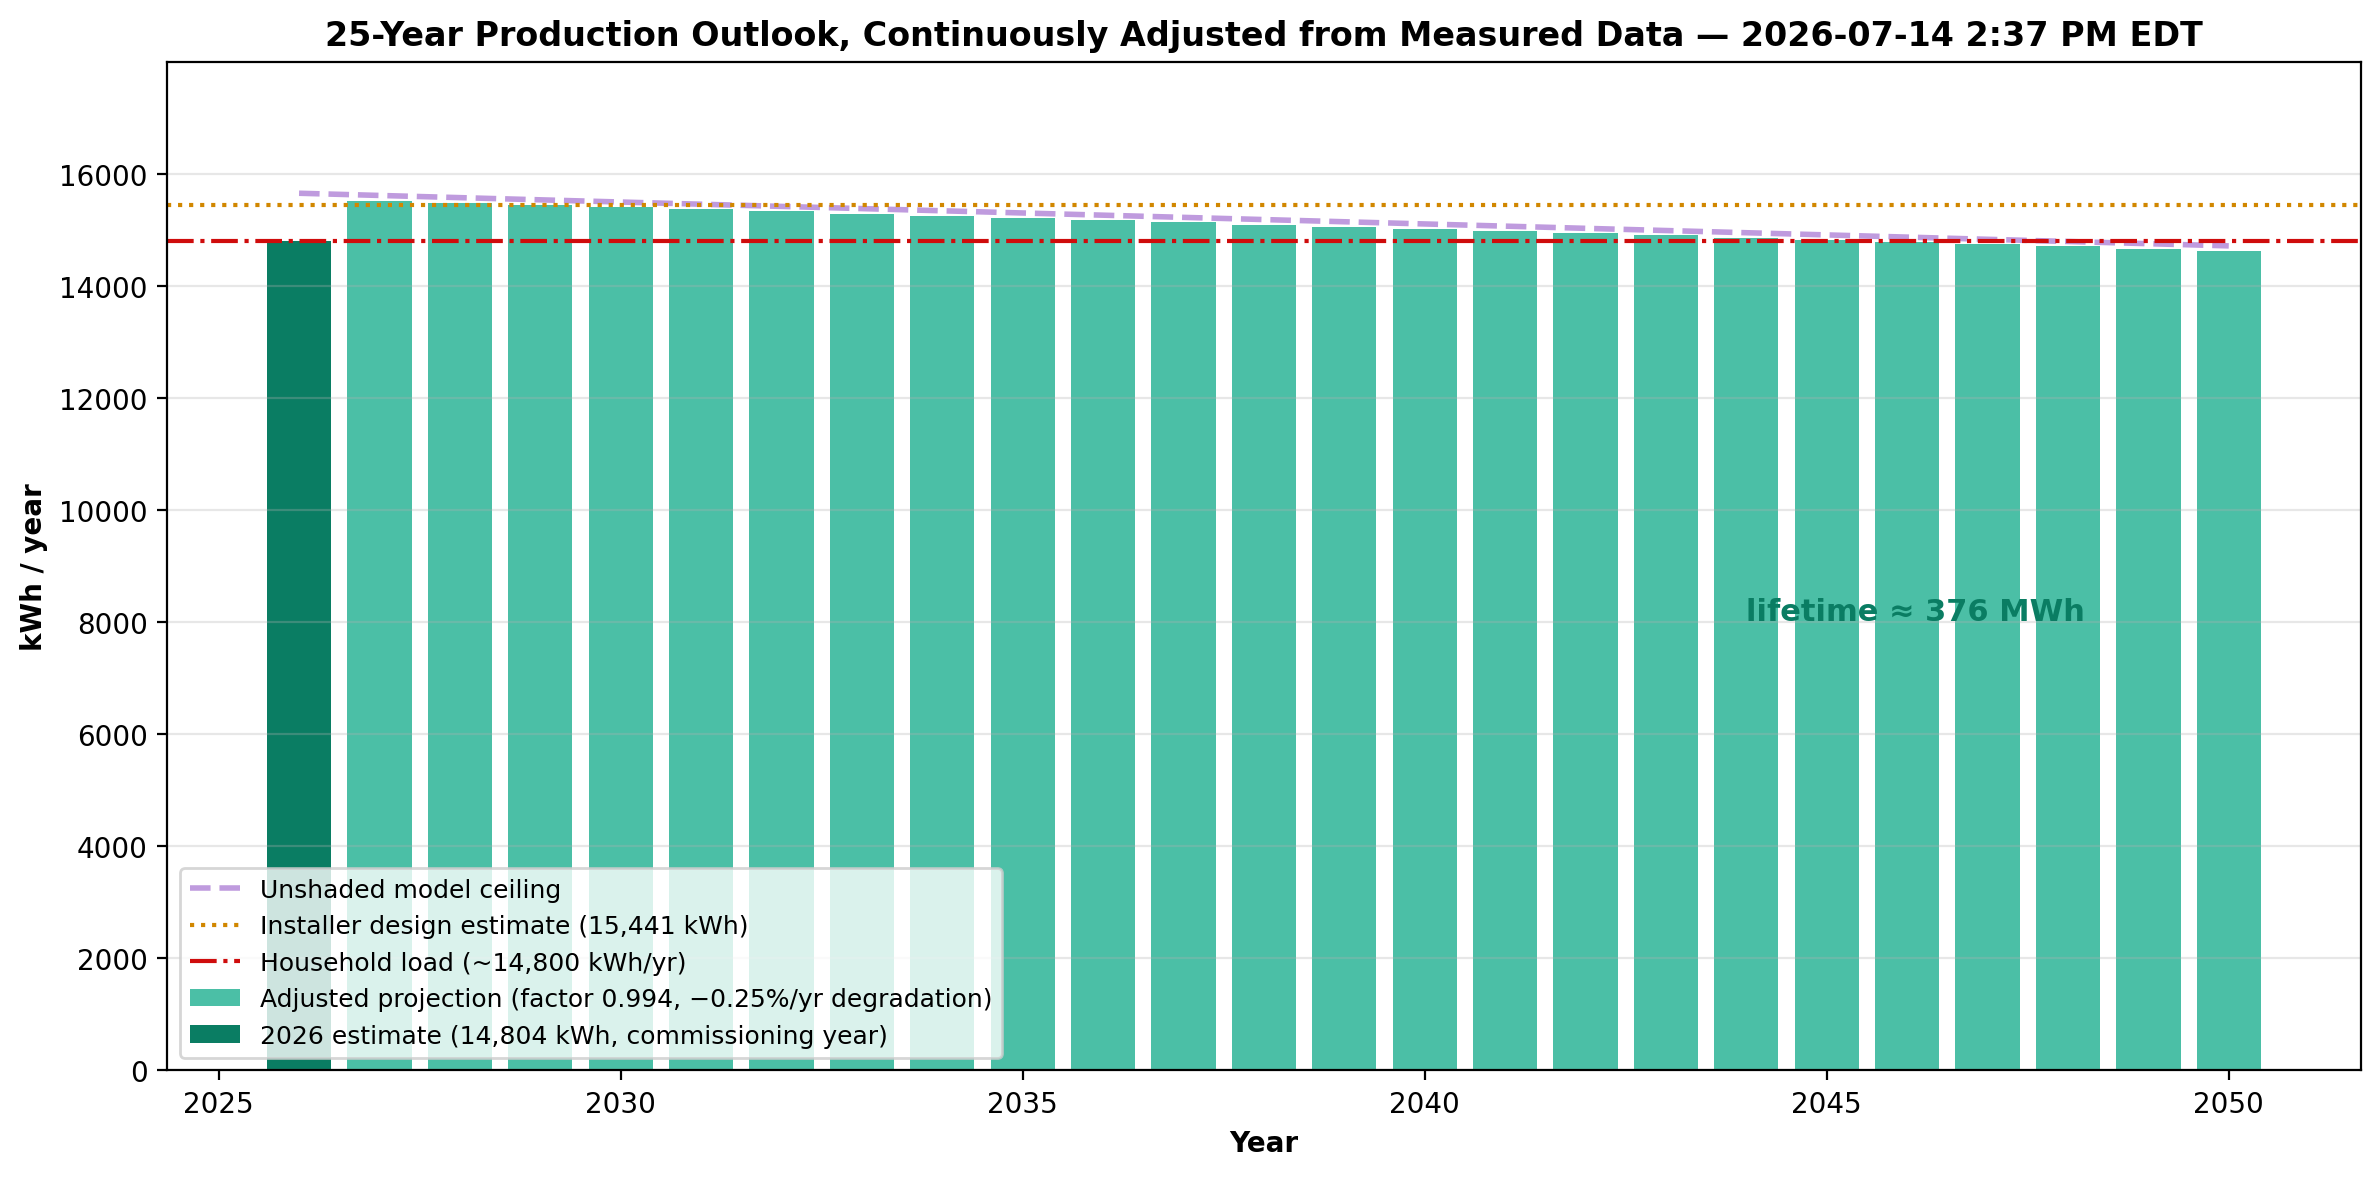
2026 estimate: 14,910 kWh (12,833 measured + adjusted model for the remainder) — below the installer's 15,441 kWh design estimate and above the pre-measurement planning band. That is roughly 101% of the household's ~14,800 kWh/yr recent average consumption. Note 2026 started January 28, so the commissioning year undercounts a full January.
Projected across the 25-year module warranty at 0.25%/yr degradation from the adjusted anchor of 15,551 kWh: 15,512 kWh in 2027, declining to 14,618 kWh in 2050, for a lifetime total of about 376 MWh. These projections re-derive themselves nightly as new months land.
| Month | Days data | Days in month | Model kWh | Actual kWh | Ratio | Complete |
|---|---|---|---|---|---|---|
| 2026-01 | 5 | 31 | 1015.0 | 100.7 | 0.099 | False |
| 2026-02 | 28 | 28 | 1183.0 | 1249.9 | 1.057 | True |
| 2026-03 | 31 | 31 | 1538.0 | 1360.7 | 0.885 | True |
| 2026-04 | 30 | 30 | 1506.0 | 1435.3 | 0.953 | True |
| 2026-05 | 31 | 31 | 1559.0 | 1478.4 | 0.948 | True |
| 2026-06 | 30 | 30 | 1461.0 | 1642.2 | 1.124 | True |
| 2026-07 | 31 | 31 | 1589.0 | 1694.0 | 1.066 | True |
| 2026-08 | 31 | 31 | 1549.0 | 1541.6 | 0.995 | True |
| 2026-09 | 30 | 30 | 1379.0 | 1288.6 | 0.934 | True |
| 2026-10 | 22 | 31 | 1097.0 | 1041.6 | 0.949 | False |
| Year | Adjusted kWh | Unshaded model kWh |
|---|---|---|
| 2026 | 14910 | 15648 |
| 2027 | 15512 | 15609 |
| 2028 | 15473 | 15570 |
| 2029 | 15434 | 15531 |
| 2030 | 15395 | 15492 |
| 2031 | 15356 | 15452 |
| 2032 | 15317 | 15413 |
| 2033 | 15278 | 15374 |
| 2034 | 15240 | 15335 |
| 2035 | 15201 | 15296 |
| 2036 | 15162 | 15257 |
| 2037 | 15123 | 15218 |
| 2038 | 15084 | 15179 |
| 2039 | 15045 | 15139 |
| 2040 | 15006 | 15100 |
| 2041 | 14967 | 15061 |
| 2042 | 14929 | 15022 |
| 2043 | 14890 | 14983 |
| 2044 | 14851 | 14944 |
| 2045 | 14812 | 14905 |
| 2046 | 14773 | 14866 |
| 2047 | 14734 | 14826 |
| 2048 | 14695 | 14787 |
| 2049 | 14656 | 14748 |
| 2050 | 14618 | 14709 |