Data Quality Report - Weather & Energy
Overall Status: CRITICAL
Report generated: 2026-07-14 14:37:03
Part 1: Weather Data Quality
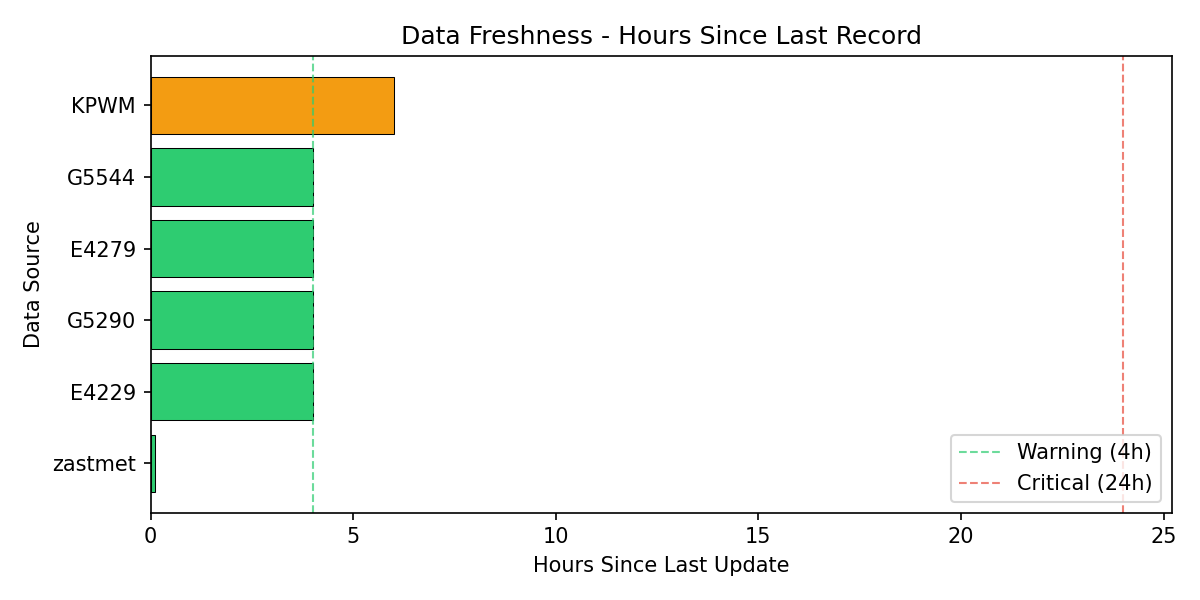
1.1 Data Freshness
Shows when each station last received data. Active stations: KPWM (Portland Jetport) and zastmet (personal weather station).
| Station |
Last Record |
Hours Stale |
Status |
| KPWM |
2026-07-14 07:51 |
6.0 |
WARNING |
| E4229 |
2026-07-14 10:15 |
4.0 |
OK |
| E4279 |
2026-07-14 10:15 |
4.0 |
OK |
| G5290 |
2026-07-14 10:15 |
4.0 |
OK |
| G5544 |
2026-07-14 10:15 |
4.0 |
OK |
| zastmet |
2026-07-14 14:30 |
0.1 |
OK |
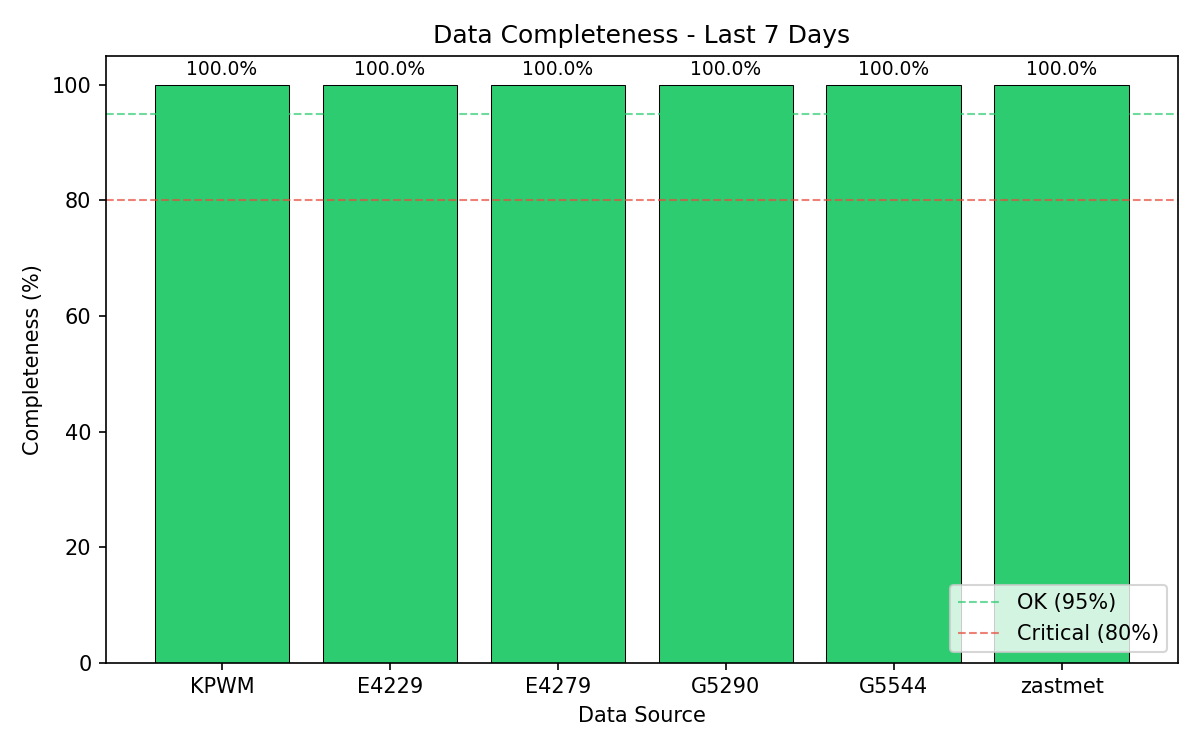
1.2 Data Completeness (Last 7 Days)
| Station |
Expected |
Actual |
Completeness |
Status |
| KPWM |
168 |
166 |
98.8% |
OK |
| E4229 |
168 |
647 |
100.0% |
OK |
| E4279 |
168 |
669 |
100.0% |
OK |
| G5290 |
168 |
1889 |
100.0% |
OK |
| G5544 |
168 |
1860 |
100.0% |
OK |
| zastmet |
2016 |
1897 |
94.1% |
WARNING |
1.3 Range Validation (Last 30 Days)
| Station |
Sensor |
Expected Range |
Actual Min |
Actual Max |
Violations |
Status |
| KPWM |
Temperature |
-40 to 110 |
53.1 |
95.0 |
0 |
OK |
| KPWM |
Humidity |
0 to 100 |
0.0 |
100.0 |
0 |
OK |
| KPWM |
Pressure |
920 to 1080 |
995.6 |
1022.7 |
0 |
OK |
| KPWM |
Wind Speed |
0 to 150 |
0.0 |
19.0 |
0 |
OK |
| E4229 |
Temperature |
-40 to 110 |
0.0 |
102.0 |
0 |
OK |
| E4229 |
Humidity |
0 to 100 |
0.0 |
99.0 |
0 |
OK |
| E4229 |
Pressure |
920 to 1080 |
1000.2 |
1023.9 |
0 |
OK |
| E4229 |
Wind Speed |
0 to 150 |
0.0 |
10.0 |
0 |
OK |
| E4279 |
Temperature |
-40 to 110 |
48.0 |
91.0 |
0 |
OK |
| E4279 |
Humidity |
0 to 100 |
1.0 |
100.0 |
0 |
OK |
| E4279 |
Pressure |
920 to 1080 |
994.9 |
1022.4 |
0 |
OK |
| E4279 |
Wind Speed |
0 to 150 |
0.0 |
6.0 |
0 |
OK |
| G5290 |
Temperature |
-40 to 110 |
48.0 |
96.0 |
0 |
OK |
| G5290 |
Humidity |
0 to 100 |
35.0 |
97.0 |
0 |
OK |
| G5290 |
Pressure |
920 to 1080 |
994.8 |
1022.3 |
0 |
OK |
| G5290 |
Wind Speed |
0 to 150 |
0.0 |
7.0 |
0 |
OK |
| G5544 |
Temperature |
-40 to 110 |
49.0 |
95.0 |
0 |
OK |
| G5544 |
Humidity |
0 to 100 |
35.0 |
96.0 |
0 |
OK |
| G5544 |
Pressure |
920 to 1080 |
996.4 |
1023.9 |
0 |
OK |
| G5544 |
Wind Speed |
0 to 150 |
0.0 |
2.0 |
0 |
OK |
1.4 Station Summary
| Station |
Total Records |
First Record |
Last Record |
| KPWM |
99,571 |
N/A |
2026-07-14 07:51 |
| E4229 |
294,061 |
N/A |
2026-07-14 10:15 |
| E4279 |
285,085 |
N/A |
2026-07-14 10:15 |
| G5290 |
161,764 |
2024-08-23 |
2026-07-14 10:15 |
| G5544 |
155,327 |
2024-11-27 |
2026-07-14 10:15 |
| zastmet |
171,646 |
2024-01-22 |
2026-07-14 14:30 |
Part 2: Energy Data Quality
2.1 Energy Data Freshness
Checks how current the energy data sources are.
| Source |
Table |
Last Record |
Staleness |
Status |
| Electric Meter (hourly) |
electric_use |
2026-07-02 |
279 hours |
CRITICAL |
| Utility Bills (monthly) |
v_monthly_utilities |
2026-06-02 |
42 days |
OK |
2.2 Energy Data Completeness
| Source |
Period |
Expected |
Actual |
Completeness |
Status |
| Electric Meter |
Last 30 days |
720 |
441.0 |
61.2% |
CRITICAL |
| Electricity Bills |
Since 2017 |
113 |
113.0 |
100.0% |
OK |
| Gas Bills |
Since 2017 |
113 |
109.0 |
96.5% |
OK |
2.3 Energy Range Validation
| Metric |
Expected Range |
Actual Min |
Actual Max |
Average |
Outliers |
Status |
| Monthly Electricity (kWh) |
200 - 3000 |
472.0 |
2069.0 |
1114.0 |
0.0 |
OK |
| Monthly Gas (therms) |
0 - 200 |
20.0 |
288.0 |
112.0 |
18.0 |
WARNING |
2.4 Energy Summary
| Source |
Total Records |
First Record |
Last Record |
Total Value |
| Electric Meter (hourly) |
108,564 |
2014-02-01 |
2026-07-02 |
160,300 kWh (net of solar export) |
| Utility Bills (monthly) |
113 months |
2017-01-02 |
2026-06-02 |
125,915 kWh + 12,201 therms |
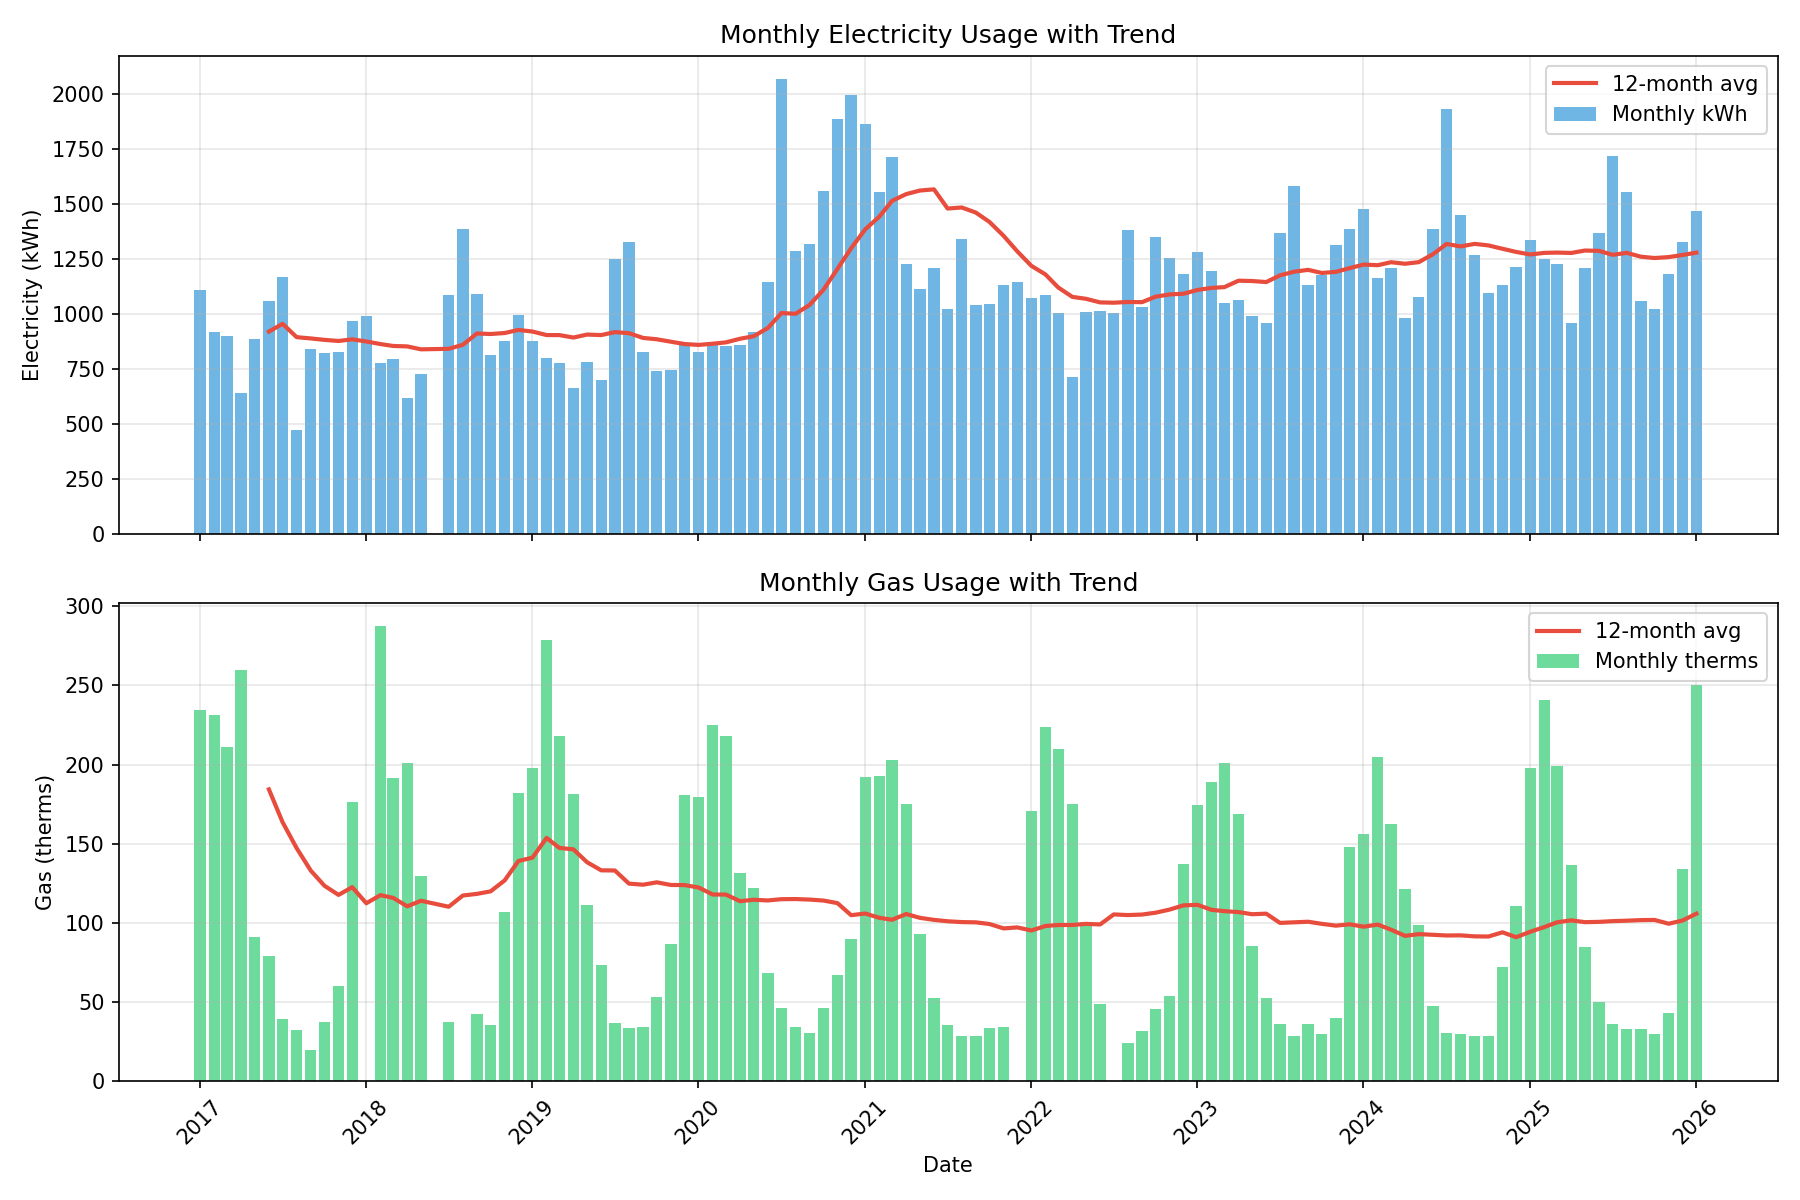
Part 3: Energy Trends & Periodicity
3.1 Usage Trends Over Time
Blue bars show monthly usage, red line shows 12-month rolling average to reveal trends.
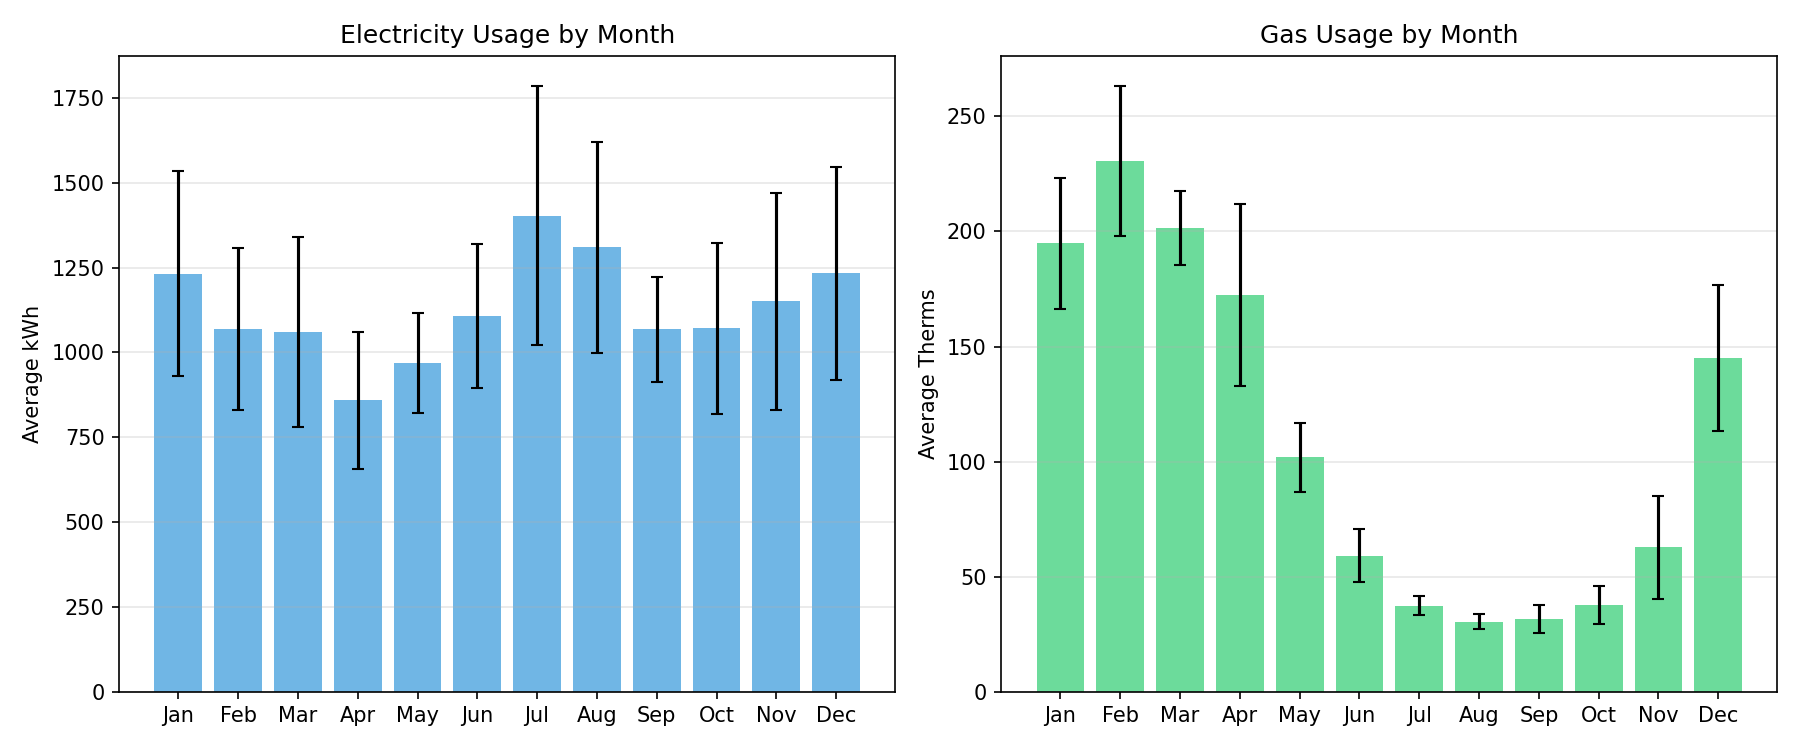
3.2 Seasonal Patterns
Average usage by month showing seasonal patterns. Error bars indicate variability.
Part 4: Solar Data Quality (SolarEdge)
4.1 API Sync Status
Status of each data type fetched from the SolarEdge API (seh_sync_metadata).
Errors here indicate the API call failed and data may be stale.
| Data Type |
Last Sync |
Last Data Timestamp |
Records Synced |
Status |
Error |
| power |
2026-07-14 14:34 |
2026-07-14 14:34 |
5 |
OK |
|
| storage |
2026-07-14 14:34 |
2026-07-14 14:34 |
0 |
OK |
|
| environmental |
2026-07-14 14:34 |
2026-07-14 14:34 |
1 |
OK |
|
| inventory |
2026-07-14 14:34 |
2026-07-14 14:34 |
6 |
OK |
|
| inverter_telemetry |
2026-07-14 14:34 |
2026-07-14 14:31 |
13 |
OK |
|
| optimizer_telemetry |
2026-07-14 14:34 |
2026-07-14 14:34 |
0 |
OK |
|
| power_details |
2026-07-14 14:34 |
2026-07-14 14:30 |
5 |
OK |
|
| site |
2026-07-14 14:34 |
2026-07-14 14:34 |
1 |
OK |
|
| equipment |
2026-07-14 14:34 |
2026-07-14 14:34 |
1 |
OK |
|
| energy |
2026-07-14 14:34 |
2026-07-14 00:00 |
2 |
OK |
|
4.2 Power Reading Completeness (Last 14 Days)
SolarEdge sends 15-minute readings (96 expected per full day).
PARTIAL means today is still in progress.
CRITICAL means fewer than 80% of readings were received.
| Date |
Readings |
Completeness |
Peak (W) |
Avg (W) |
Status |
| 2026-07-14 |
58 |
60.4% |
7,044 |
1,696 |
PARTIAL |
| 2026-07-13 |
95 |
99.0% |
10,636 |
2,770 |
OK |
| 2026-07-12 |
95 |
99.0% |
11,174 |
2,566 |
OK |
| 2026-07-11 |
95 |
99.0% |
11,255 |
2,720 |
OK |
| 2026-07-10 |
95 |
99.0% |
10,895 |
2,557 |
OK |
| 2026-07-09 |
95 |
99.0% |
11,043 |
2,489 |
OK |
| 2026-07-08 |
95 |
99.0% |
10,412 |
2,871 |
OK |
| 2026-07-07 |
95 |
99.0% |
8,713 |
1,659 |
OK |
| 2026-07-06 |
95 |
99.0% |
8,309 |
2,361 |
OK |
| 2026-07-05 |
95 |
99.0% |
11,201 |
2,787 |
OK |
| 2026-07-04 |
95 |
99.0% |
10,429 |
2,278 |
OK |
| 2026-07-03 |
95 |
99.0% |
10,025 |
2,792 |
OK |
| 2026-07-02 |
95 |
99.0% |
9,876 |
2,728 |
OK |
| 2026-07-01 |
95 |
99.0% |
10,962 |
2,567 |
OK |
| 2026-06-30 |
95 |
99.0% |
10,662 |
2,653 |
OK |
4.3 Daily Energy Completeness (Last 30 Days)
Daily energy totals from seh_energy_readings.
Missing days indicate the API did not return data for that date.
Today is always missing until the day is complete.
Missing days (excl. today): 0
| Date |
Energy (Wh) |
Energy (kWh) |
Status |
| 2026-07-14 |
23,579 |
23.58 |
OK |
| 2026-07-13 |
66,488 |
66.49 |
OK |
| 2026-07-12 |
61,144 |
61.14 |
OK |
| 2026-07-11 |
61,368 |
61.37 |
OK |
| 2026-07-10 |
61,276 |
61.28 |
OK |
| 2026-07-09 |
57,659 |
57.66 |
OK |
| 2026-07-08 |
68,168 |
68.17 |
OK |
| 2026-07-07 |
39,900 |
39.90 |
OK |
| 2026-07-06 |
56,173 |
56.17 |
OK |
| 2026-07-05 |
65,854 |
65.85 |
OK |
| 2026-07-04 |
54,953 |
54.95 |
OK |
| 2026-07-03 |
66,021 |
66.02 |
OK |
| 2026-07-02 |
64,872 |
64.87 |
OK |
| 2026-07-01 |
60,029 |
60.03 |
OK |
| 2026-06-30 |
62,677 |
62.68 |
OK |
| 2026-06-29 |
67,824 |
67.82 |
OK |
| 2026-06-28 |
66,348 |
66.35 |
OK |
| 2026-06-27 |
60,917 |
60.92 |
OK |
| 2026-06-26 |
36,859 |
36.86 |
OK |
| 2026-06-25 |
62,801 |
62.80 |
OK |
| 2026-06-24 |
65,028 |
65.03 |
OK |
| 2026-06-23 |
40,170 |
40.17 |
OK |
| 2026-06-22 |
37,252 |
37.25 |
OK |
| 2026-06-21 |
38,799 |
38.80 |
OK |
| 2026-06-20 |
59,899 |
59.90 |
OK |
| 2026-06-19 |
58,474 |
58.47 |
OK |
| 2026-06-18 |
7,087 |
7.09 |
OK |
| 2026-06-17 |
70,765 |
70.77 |
OK |
| 2026-06-16 |
63,633 |
63.63 |
OK |
| 2026-06-15 |
59,584 |
59.58 |
OK |
4.4 Solar Data Summary
8,175.1
Total kWh Produced
| Metric |
Value |
Status |
| Power data freshness |
0h since last reading |
OK |
| Data collection start |
2026-01-27 |
OK |
| Days with data / Calendar days |
169 / 169 (100.0%) |
OK |
4.5 Historic Data Gaps (Full Collection History)
Itemized list of all days since data collection began that have missing or
low-completeness readings. Days with <95% power readings are flagged WARNING;
days with <80% are CRITICAL. The first day of collection is expected to be partial.
2026-01-27
Collection Start
169
Calendar Days in Span
0
Days with No Power Data
Power Reading Gaps (<95% completeness, excl. today)
| Date |
Readings |
Completeness |
Status |
Note |
| 2026-01-27 |
41 |
42.7% |
CRITICAL |
First day — collection started mid-day |
Missing Daily Energy Records
No missing daily energy records — all calendar days in the collection span have energy data.
Quality Check Thresholds
Weather Data
- Freshness: Warning at 4h, Critical at 24h
- Completeness: Warning at 95%, Critical at 80%
- Temperature Range: -40F to 110F
Energy Data
- Utility Bill Freshness: Warning at 45 days, Critical at 90 days
- Monthly Electricity: 200 - 3000 kWh
- Monthly Gas: 0 - 200 therms
Data Quality Report generated by data_quality_report.py
Part of the Cumberland Center Weather Monitoring System